
FIGURE 3.
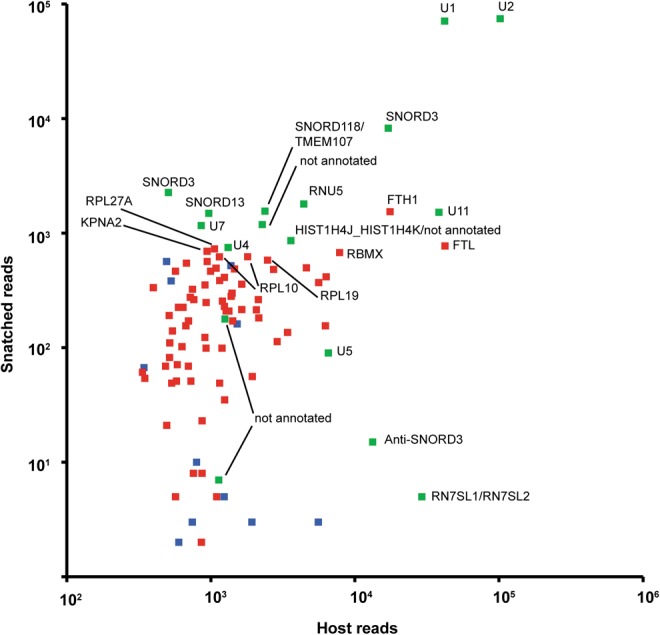
The correlation of the level of snatched sequences with that of the donor RNAs at 24 h. Y-axis, the read number of snatched sequences; X-axis, the read number of the human donor RNAs. Green indicates snatched sequences matching non-protein-coding regions, blue indicates sequences from protein-coding regions but not within known TSS regions, and red indicates snatched sequences in the −100 to +100 regions of the TSSs of protein-coding genes.