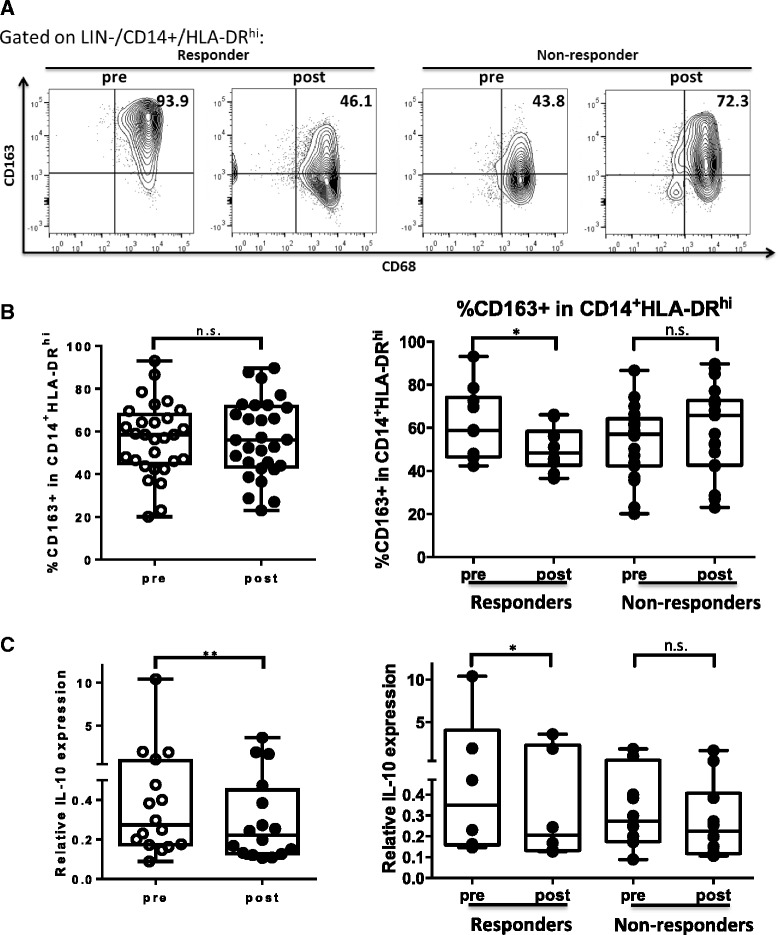
Fig. 3.

Cetuximab responders showed decreased CD163+ cells and IL-10 transcripts in circulating CD11b+CD14+HLA-DRhi monocytes after cetuximab treatment. a Representative figures showing percentage of CD68+CD163+ cells in circulating CD11b+CD14+HLA-DRhi cells from responders and non-responders during, pre- and post-neoadjuvant cetuximab treatment. b Summary data of frequency of CD163+ cells in CD11b+ CD14+HLA-DRhi monocytes in the peripheral circulation pre- and post-cetuximab treatment in the total 29 HNSCC patients (left panel) and in responders (n = 10, *p < 0.05) and non-responders (n = 19) of UPCI 08–013 trial. Circulating CD11b+CD14+HLA-DRhi monocytes were sorted from PBMC of 14 cetuximab treated patients and RNA was isolated for real time quantitative PCR analysis of IL-10 transcripts. c Summary data showing relative IL-10 expression in circulating CD11b+CD14+HLA-DRhi monocytes pre- and post-cetuximab treatment in the total 14 HNSCC patients tested (left panel, *p < 0.05) and in responders (n = 6, *p < 0.05) and non-responders (n = 8) in the neoadjuvant cetuximab trial (right panel). The quantity of each cDNA sample was normalized by GUSB. All of the experiments were performed in triplicate. Statistical significance was determined by Wilcoxon matched-pair signed rank tests. *p < 0.05. p > 0.05 was considered to be not significant (n.s.)
