
Fig. 1.
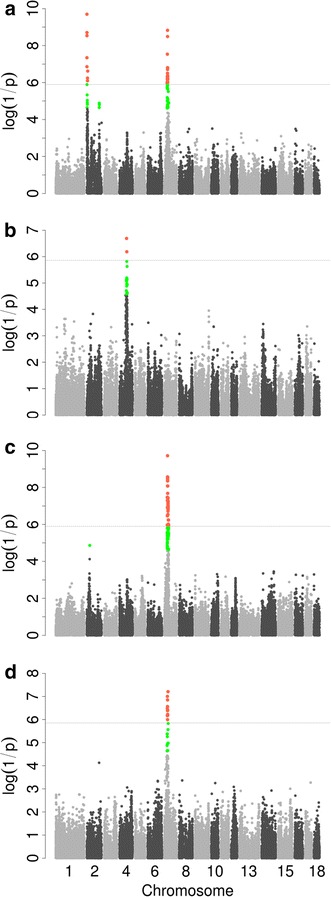
Single-population GWAS results for heart weight and liver weight. Manhattan plots for heart weight in F2 (a) and Laiwu pigs (b), and for liver weight in F2 (c) and Laiwu pigs (d). In the Manhattan plots, negative log10 p values of the SNPs were plotted against their genomic positions; the red and green dots represent SNPs that exceeded the suggestive and 5 % genome-wide significance thresholds, respectively; solid lines indicate the 5 % genome-wide Bonferroni-corrected threshold