
Fig. 1.
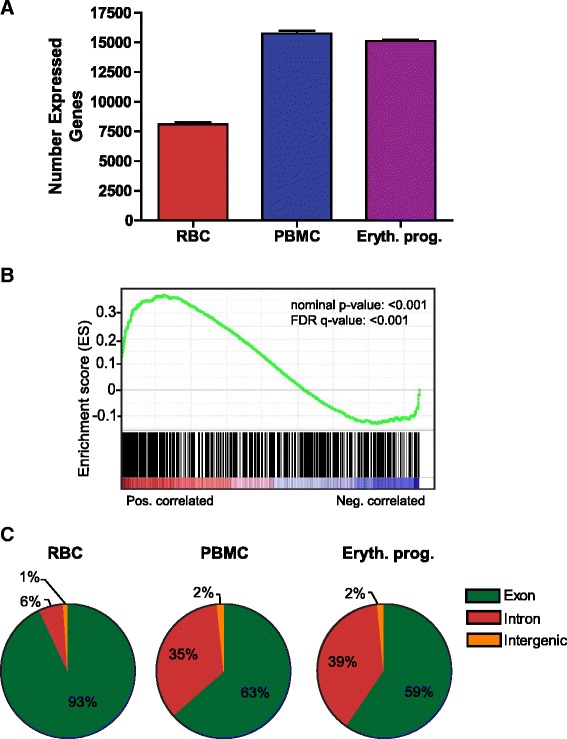
Population characteristics of erythrocyte long RNAs. a Distribution of total number of expressed transcripts across indicated cell types. A transcript was considered expressed if the RPKM value was ≥0.5. b GSEA analysis of the top 500 expressed erythrocyte transcripts in the ranked expressed transcripts of the day 8 erythroid progenitor (D8) vs. PBMC samples. c Distribution of the genomic location for RNA-Seq reads. Locations represent average number of reads for the three RBC, three PBMC, and two erythroid progenitor independent samples. Intronic reads are included if <10 kb upstream of a transcription start site or <10 kb downstream of a transcription end site