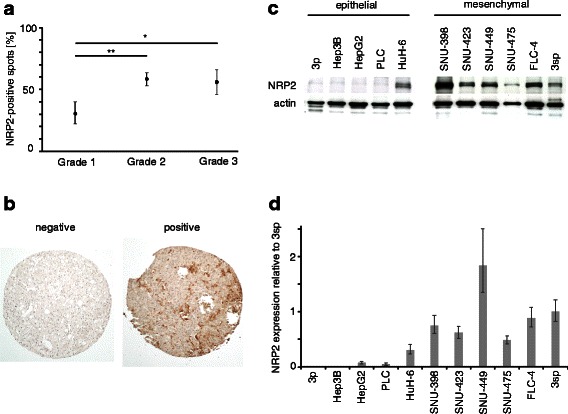
Fig. 1.

NRP2 expression in primary HCC tissue and HCC cell lines. a NRP2 expression correlated with less differentiated HCC of grade 2 and 3. b Representative images of no (left) and low-to-high NRP2 expression (right). c, d Western blot (c) and qPCR analysis (d) of epithelial and mesenchymal-like HCC cells. Expression of actin is shown as loading control. NRP2 expression in 3sp cells was set to a value of 1 to allow comparison of NRP2 levels in the various cell lines. Error bars depict SD from 3 independent experiments that were performed in triplicates.*, p < 0.05; **, p < 0.01
