Fig. 3.

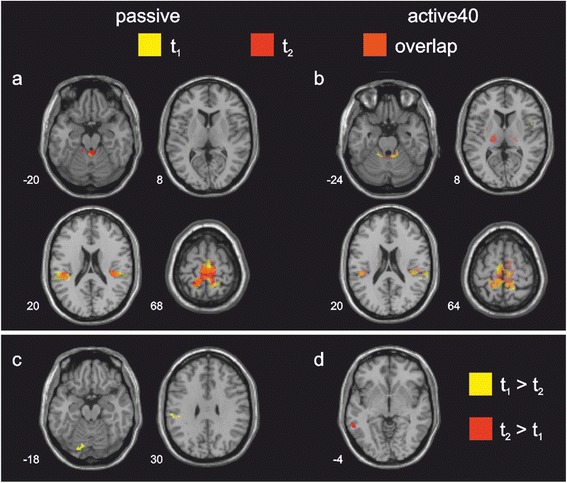
Activation maps during passive and active40 stepping. Top row: Regions of significant BOLD signal increase during passive (a) and active40 (b) stepping at session 1 (t1) and 2 (t2), and their overlap. Bottom row: Areas of significantly higher BOLD signal increase at either t1 or t2 for passive (c) and active40 (d). Time between t1 and t2 ranged between 42 and 48 days. The sections were taken at the z-coordinate indicated at the bottom left of each section, images are displayed in neurological convention (i.e., left is left), p ≤ 0.001, cluster corrected, k = 42 voxels
