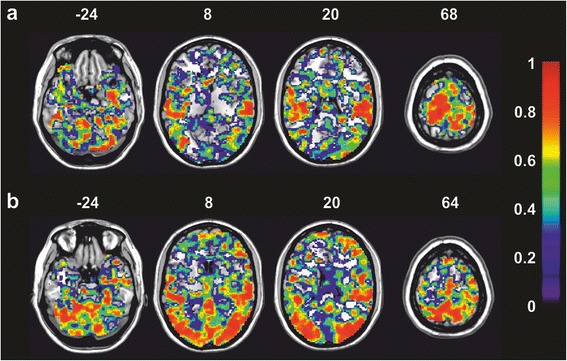
Fig. 5.

Voxel-wise maps of intra-class correlation coefficients for repeated sessions of passive and active40 stepping. Maps of intra-class correlation coefficients (ICCgroup) for repeated sessions of passive (a) and active40 (b) stepping shown on different axial slices (the z-coordinate is indicated at the top of each slice). Bilateral S2 and the paracentral lobule show high ICC in both conditions, while occipital, posterior parietal and prefrontal regions show high ICC as well in active40. Areas with high ICC (red) are hence not necessarily congruent with areas of activation above threshold. Images are displayed in neurological convention (i.e. left is left). The scale on the right indicates the ICC
