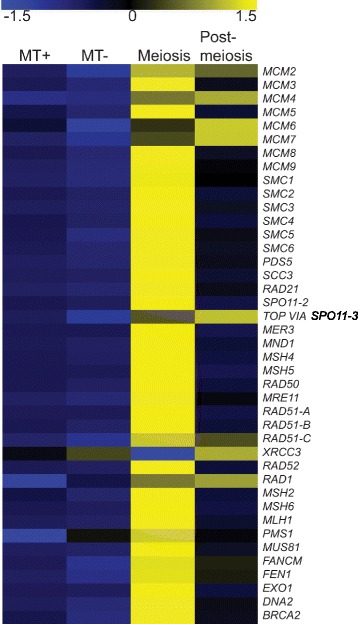
Fig. 4.

Expression profiles of the meiotic toolkit transcripts found in the transcriptome of Seminavis robusta. Expression values (normalized cpm) were determined for dark-synchronized monoclonal cultures (MT+ and MT-) (7 to 10 h after illumination) and for dark-synchronized mixed MT+ and MT- cultures sampled at the time for meiosis (9-10 h after illumination) and post-meiosis (19–22 h after illumination). Blue colour indicates down-regulation and yellow colour upregulation of expression
