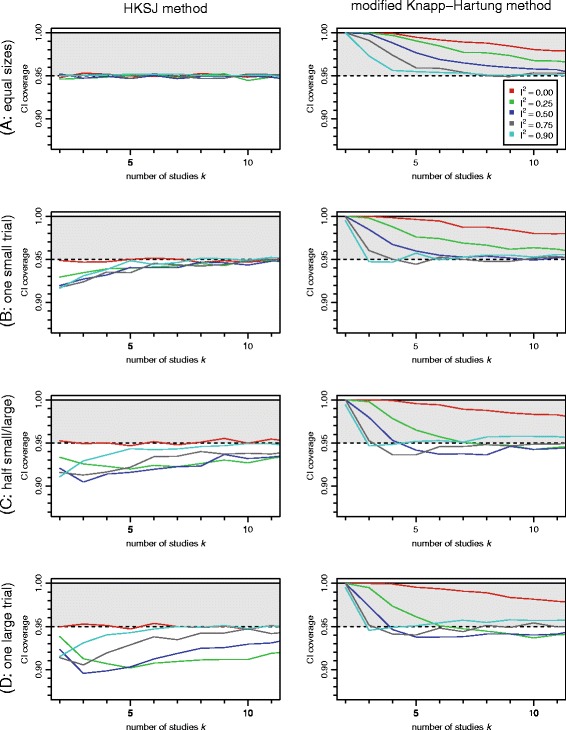
Fig. 1.

Coverage probabilities of HKSJ and mKH 95 % confidence intervals. Probabilities are shown in dependence of the number k of studies and the amount of heterogeneity I 2. The four different scenarios A–D correspond to different amounts of imbalance between the study-specific standard errors s i. The DerSimonian-Laird (DL) method was used for estimation of the heterogeneity variance τ 2
