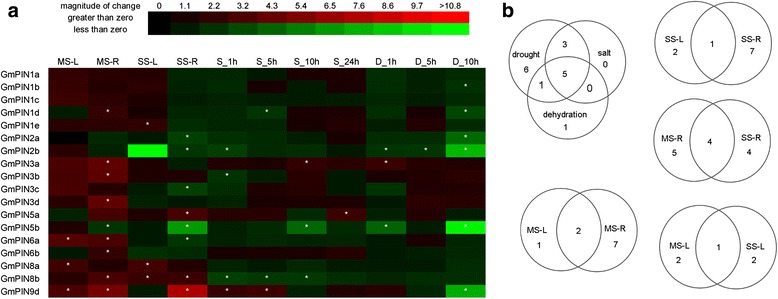
Fig. 6.

Expression profiles of GmPINs under drought, salt and dehydration conditions. (a) Fold changes of GmPIN gene expression under drought, salt and dehydration stresses. Data represented the means of three biological and two technical replicates. The asterisks indicate an absolute fold change ≥ 2 and P value <0.05 by Student's t-test. (b) Venn diagram analysis of GmPIN gene expression under drought, salt and dehydration stresses. MS-L, mild drought stress shoots; MS-R, mild drought stress roots; SS-L, moderate drought stress shoots; SS-R, moderate drought stress roots; S-1 h, salt 1 hour; S-5 h, salt 5 hour; S-10 h, salt 10 hour; S-24 h, salt 24 hour; D-1 h, dehydration 1 hour; D-5 h, dehydration 5 hour; D-10 h, dehydration 10 hour
