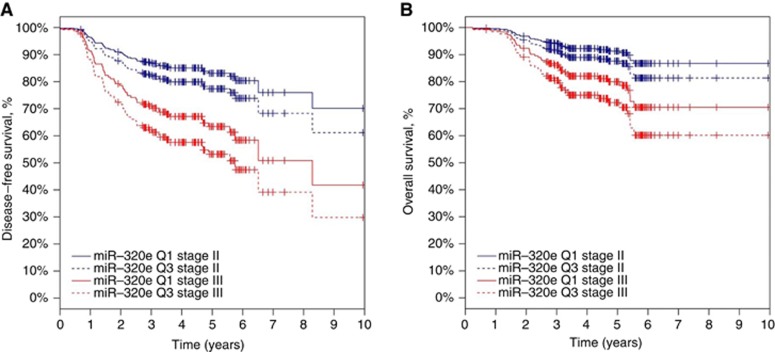
Figure 3.
Predicted DFS and OS functions. Predicted DFS (A) and OS (B) from the Cox regression model containing TNM stage, tumour location and miR-320e expression to visualise the hazard ratios reported in Table 2. Tumour location was set to the left side for calculating the predicted functions. Stage II curves are blue; stage III curves are red. Q1 (solid line) denotes patients with miR-320e expression at the 25th percentile, whereas Q3 (dashed line) denotes patients with miR-320e expression at the 75th percentile. Thus, the curves represent survival functions for patients in the middle of the bottom half of the miR-320e distribution vs those in the middle of the top half of the miR-320e distribution.

