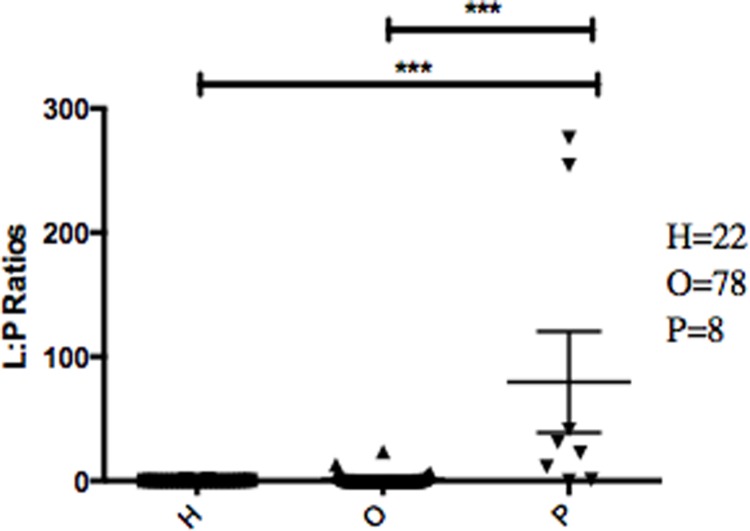
Figure 3. Abundance ratio of Leptotrichia to Porphyromonas between different patient categories.
Each symbol represents the ratio of Leptotrichia Oral Taxon 221 and Leptotrichia hongkongenesis to Porphyromonas for an individual patient (n = 108). Patients are grouped into 3 different categories depending on their diagnosis: healthy control (H), other diseases (including cancer) (O), and pancreatic cancer (P). Horizontal bar and error bars represent the mean and SEM, respectively. ∗∗∗p < 0.001 (Kruskal–Wallis test followed by Dunn’s multiple-comparison test).

