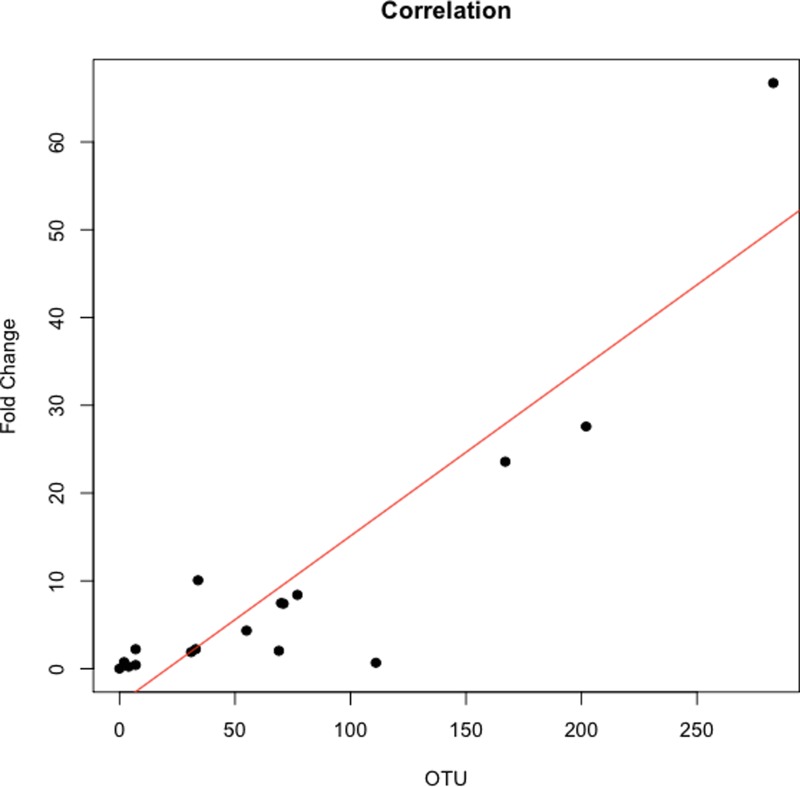
Figure 4. Correlation between Leptotrichia abundance from 16S rRNA sequences and from real-time qPCR.
Cross validation of total Leptotrichia OTU abundance using real-time qPCR. After using 16S rRNA as a reference gene for normalization of the levels of Leptotrichia genus, data was normalized by fold change to three healthy controls with relatively low Leptotrichia OTU abundance. Each symbol represents a patient: P = 6, and O = 12. Leptotrichia OTU abundance was correlated with qPCR fold change according to Pearson’s correlation (r = 0.903).

