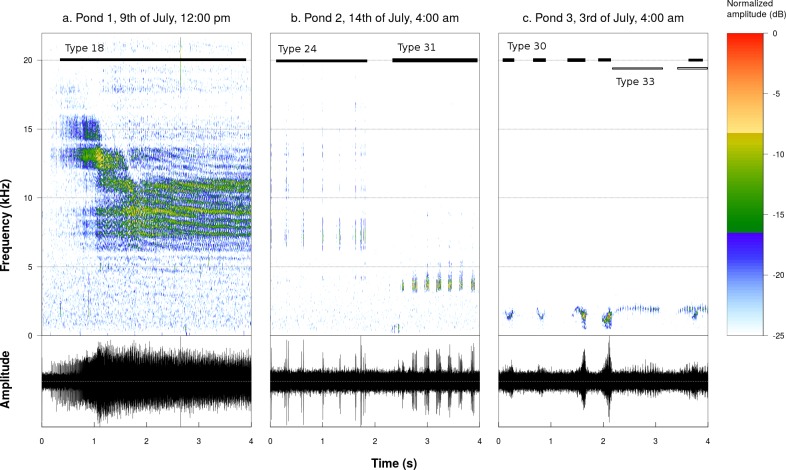
Figure 1. Spectrograms and oscillograms of chosen sound productions illustrating the acoustic diversity found in the studied ponds (Fourier window length: 1,024 samples, frame overlap: 50%, window type: Hanning).
(A) Sound type 18 recorded in pond 1 on the 9th of July at 12:00 pm. (B) Sound types 24 and 31 recorded in pond 2 on the 3rd of July at 4:00 am. (C) Sound types 30 and 33 recorded in pond 3 on the 14th of July at 4:00 am. Sound type numbers refer to Supplemental Information.

