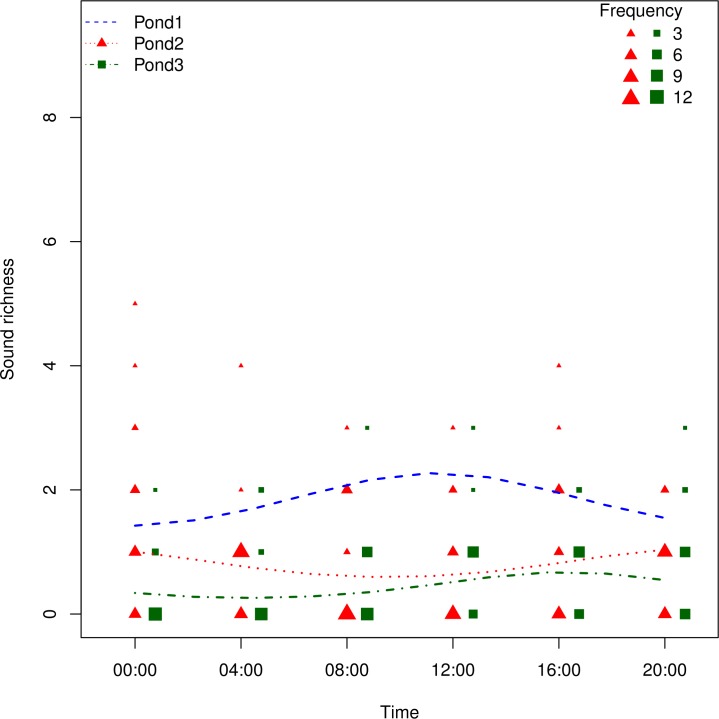
Figure 4. Frequency distribution of sound type richness as a function of time.
The size of each point is related to the number of recordings containing the same number of different sound types (total number of recordings N = 332). The three dashed lines show the fitted model for each of the three ponds.

