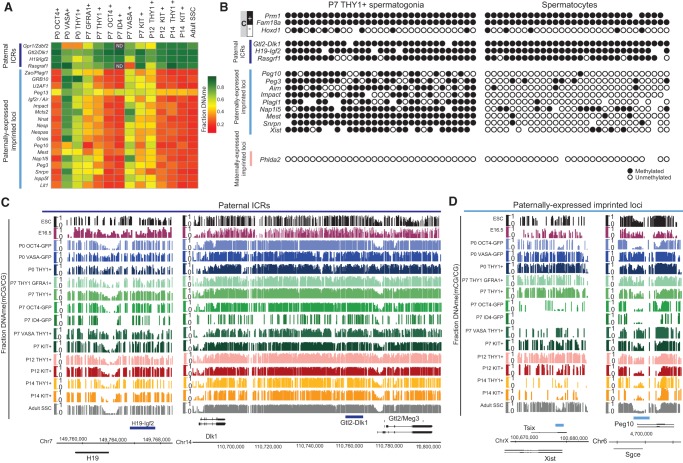
Figure 4.
THY1+-enriched SSCs have improper imprinting (high DNAme) at most paternally expressed imprinted loci. (A) Heat map summarizing the fraction DNAme of the DMR at all known paternal imprinting control regions (ICRs) and paternally expressed imprinted loci. Grey boxes with ND (not determined) within are regions with insufficient sequencing coverage in high-ID4 data sets. (B) Single-cell DNAme validation of 16 loci in P7 THY1+-enriched SSCs and in spermatocytes using the Fluidigm Biomark system. Genomic loci analyzed include known methylated (M) and unmethylated (U) control loci, paternally imprinted ICRs (highlighted in dark blue), paternally expressed imprinted loci (highlighted in light blue), and maternally expressed imprinted loci (highlighted in pink). (C) DNAme genomic snapshots of paternally imprinted ICRs (e.g., H19/Igf2 and Dlk1/Gtl2). The dark-blue bar depicts the ICR. (Y-axis) Fraction CG DNAme. (D) DNAme genomic snapshots of paternally expressed imprinted loci (e.g., Xist [left] and Peg10 [right]). (Y-axis) Fraction CG DNAme in ESCs, PGCs, and prepubertal and adult SSCs. The blue bar depicts previously defined imprinted loci.

