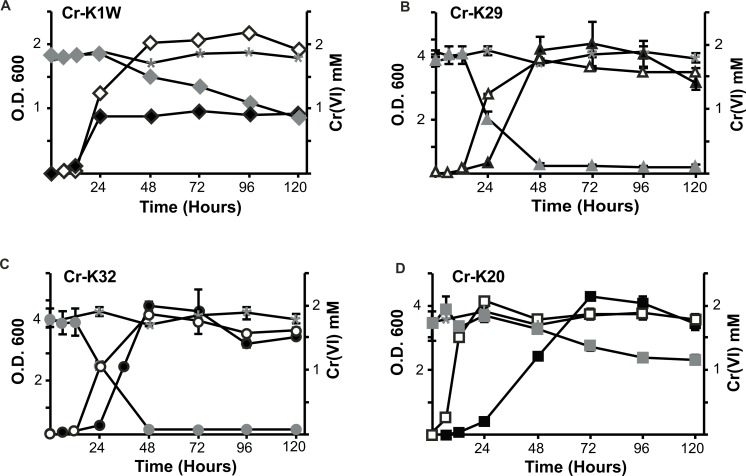
Figure 1. Comparison of the isolate’s ability to grow and reduce chromate.
Chromate reduction (gray fill) and growth curves of Microbacterium spp. in the presence (black fill) or absence (no fill) of chromate. Negative (uninoculated) controls for chromate reduction are labeled in each graph with an asterisk. (A) Cr-K1W, diamond; (B) Cr-K29, triangle; (C) Cr-K32, circle; (D) Cr-K20, square (n = 3, error bars are SD).

