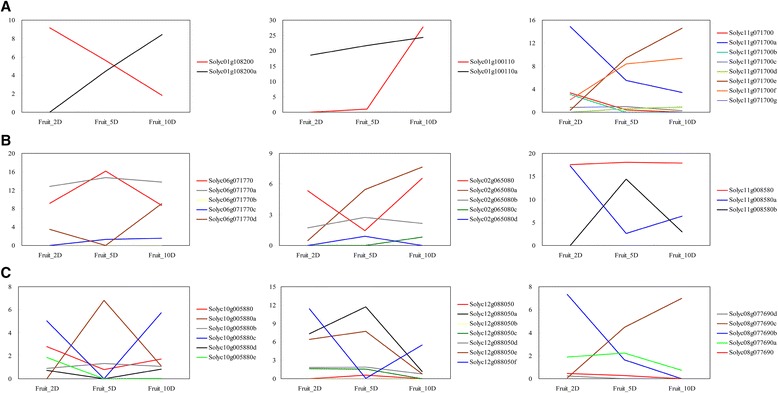
Fig. 5.

Expression values of mRNA isoforms of differential splicing genes during early fruit growth. a Three representative genes showing differential splicing between 2 and 5 dpa. b Three representative genes showing differential splicing between 5 and 10 dpa. c Three representative genes showing differential splicing between 2 and 10 dpa. Expression values of individual isoforms in FPKM were estimated by Cuffnorm. Description of the nine representative genes can be found in Table 2
