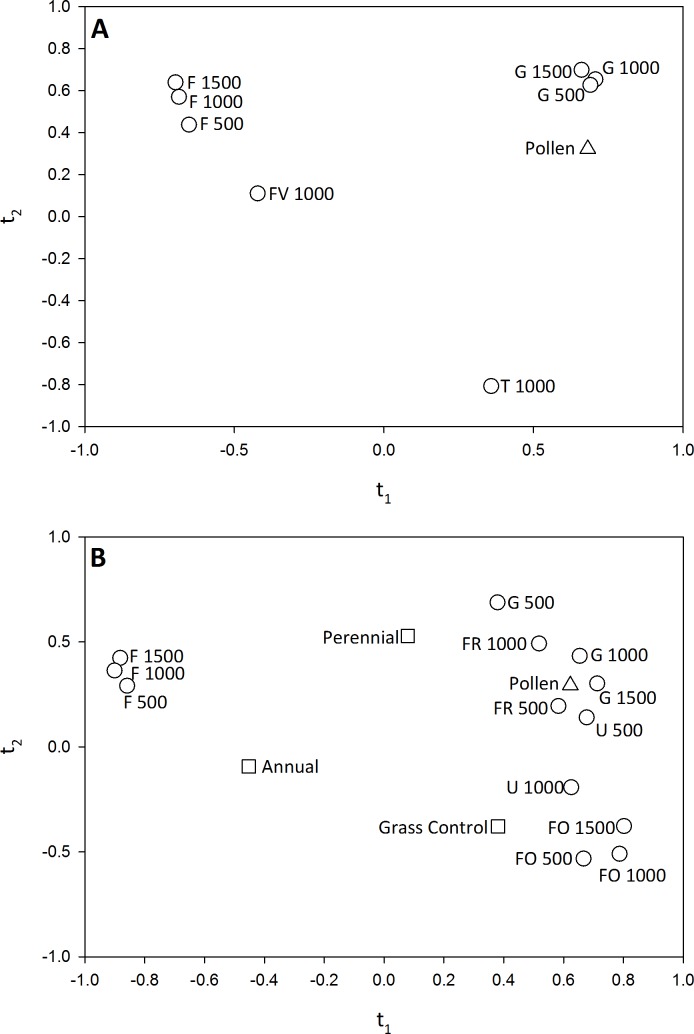
Figure 6. Correlation maps for the PLS regression of (A) pollen deposition and landscape variables in 2011 and (B) pollen deposition and habitat management and landscape variables in 2012.
Only landscape variables with a VIP >0.8 for the PLS component t1 are shown. In (B) habitat management variables are shown, but none had a VIP score of >0.8, indicating that the addition of habitat management did not significantly influence pollen deposition. Variable abbreviations as follows: Grassland (G), Forest (FO), Forage (FR), Field Crops (F), Fruit and Vegetable Crops (FV), Urban (U) and Turf (T).

