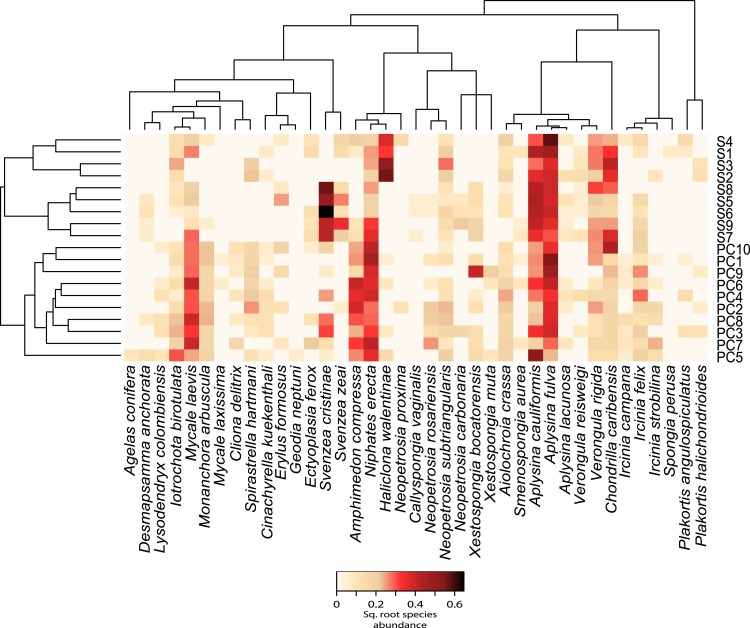
Figure 2. Relative abundance heatmap of sponge species encountered within each transect.
These data are square-root transformed for easier visualization. A Bray–Curtis dissimilarity dendrogram on the left highlights the taxonomic dissimilarity among transects. The reconstructed phylogeny of these sponge species is displayed across the top, and species names are displayed across the bottom. S(1–9) represent transects near Saigon Bay, which are closer to a larger number of residences, while PC(1–10) represent transects at Punta Caracol.

