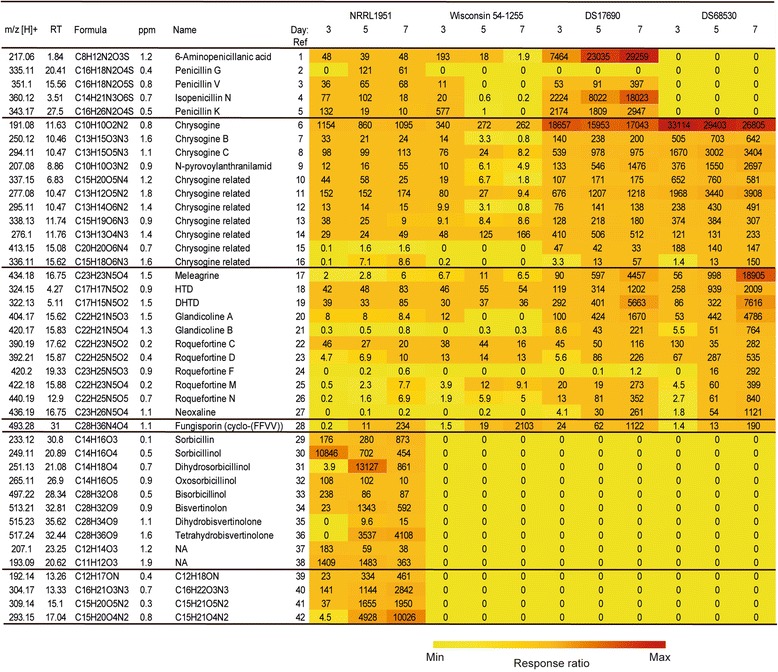
Fig. 5.

Response ratio of secondary metabolite concentrations present in the culture broth of strains NRRL1951, Wisconsin 54-1255, DS17690 and DS68530. Cell coloring corresponds to the internal standard corrected peak area of the detected metabolites in the culture broth after 3, 5 and 7 days of growth. The mass to charge ratio (m/z) of the protonated metabolites, retention time (RT) and empirical formulas are indicated. Abbreviations: HTD, histidyltryptophanyldiketopiperazine; DHTD, dehydrohistidyltryptophanyldi-ketopiperazine; NA, metabolites without structural data
