
Fig. 1.
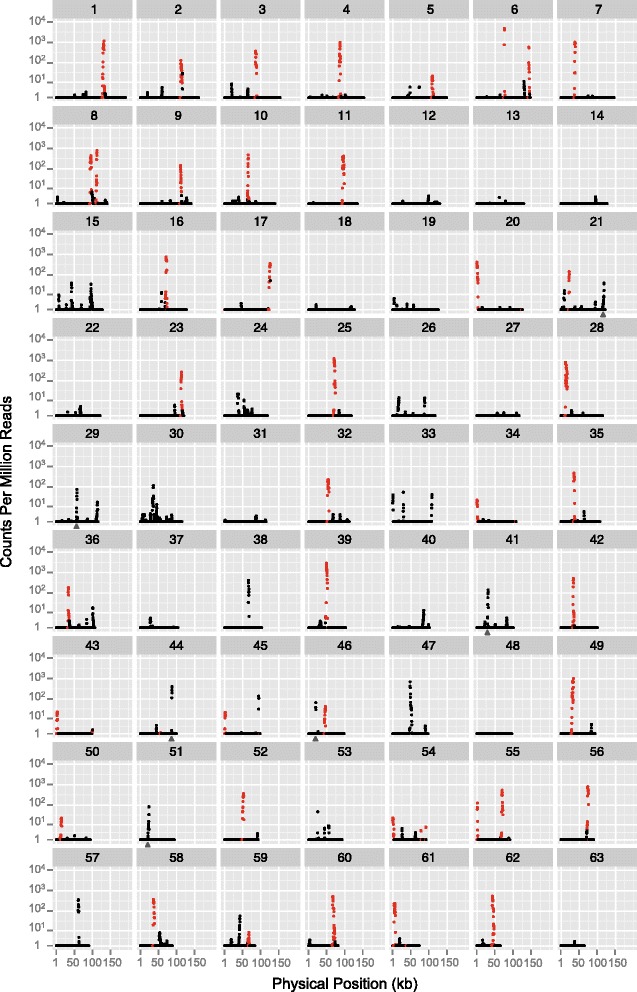
mRNA-seq read depth across the 63 chromosomes of the Silene noctiflora mitochondrial genome. Coverage estimates (in counts per million reads) are based on a sliding window with a window size of 500 bp and a step size of 250 bp for the average of two mitochondrial-enriched libraries. Coverage values for forward and reverse strands were combined. The red points represent annotated gene regions, including introns and 2 kb of 5’ and 3’ flanking sequences, whereas the black points represent sequences outside of these regions. The gray triangles indicate high-depth regions with sequence identity with intact mitochondrial genes from elsewhere in the genome such that read depth estimates may be the results of cross-mapping. The plot was generated with the ggplot2 library (http://ggplot2.org/) in R