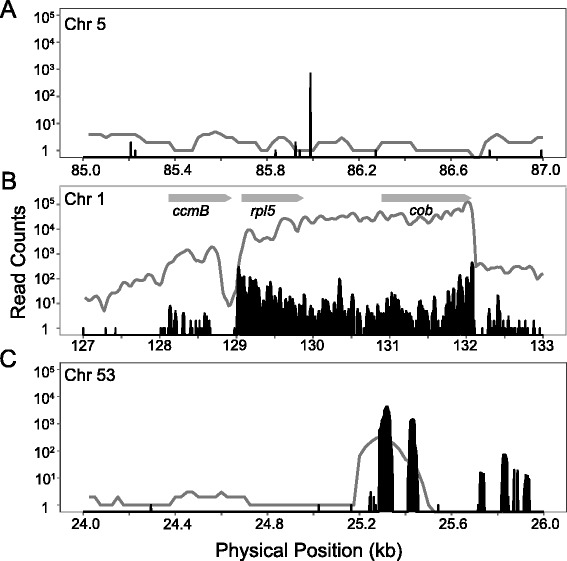
Fig. 4.

Examples of regions with small-RNA expression. The vertical black lines represent position-specific read counts for small RNAs averaged from two mitochondrial-enriched libraries. The gray lines represent mRNA-seq coverage based on a sliding window as described for Fig. 1. Coverage estimates are based only on reads mapping to the forward strand. a an example of a small RNA with reads all mapping to the same start site in a region that does not contain longer RNA transcripts; (b) an example of a region with highly expressed protein-coding genes and abundant small RNAs that are likely derived from degraded mRNA transcripts; gray arrows indicate the orientation of the coding strand; (c) an example of an IGS with both small RNAs and longer transcripts; note that the small RNAs are not localized to a single start site
