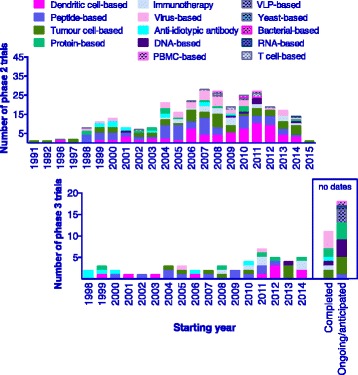
Fig. 3.

Evolution of Phase 2 and Phase 3 trial registration over time. Using a total of 347 studies where trial start date was available the number of phase 2 and phase 3 trial registered per year since 1999 is shown. Twenty nine phase 3 entries did not include start dates and are sorted based on continuing (ongoing or anticipated) or completed status
