
Fig. 1.
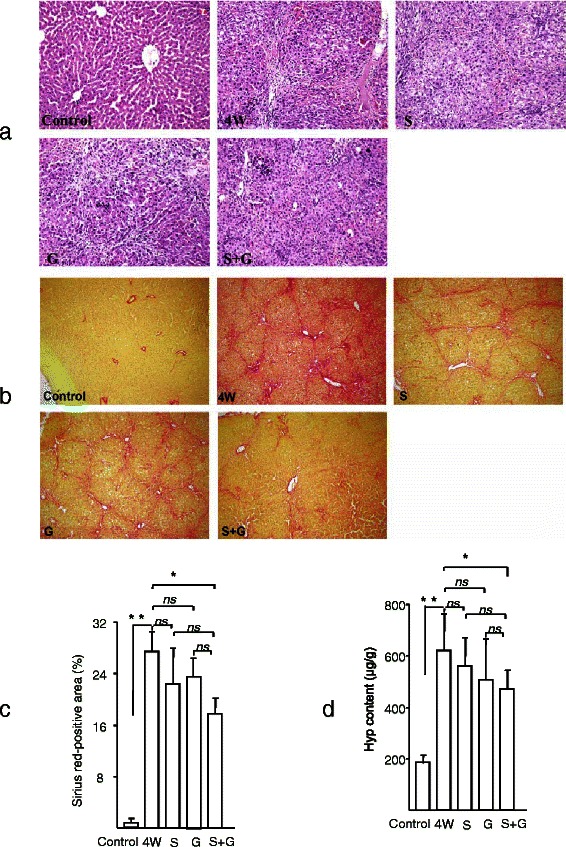
Effects of sorafenib and/or GdCl3 on histological changes of rat livers. a Histological images of rat livers stained with HE (magnification X200). b Histological images of rat livers stained with Sirius red (magnification X100). c qualification of Fig. 1b. d Liver Hyp content. The number in HE, Sirius red staining, and Hyp detection was as the same as the animal number in each group. All results are expressed as mean ± S.D. *, p < 0.05; ** p < 0.01 vs 4 W. Control, vehicle alone; 4 W, DMN for 4 weeks; S, DMN for 4 weeks plus sorafenib for 2 weeks; G, DMN for 4 weeks plus GdCl3 for 2 weeks; S + G, DMN for 4 weeks plus sorafenib and GdCl3 for 2 weeks