Fig. 4.

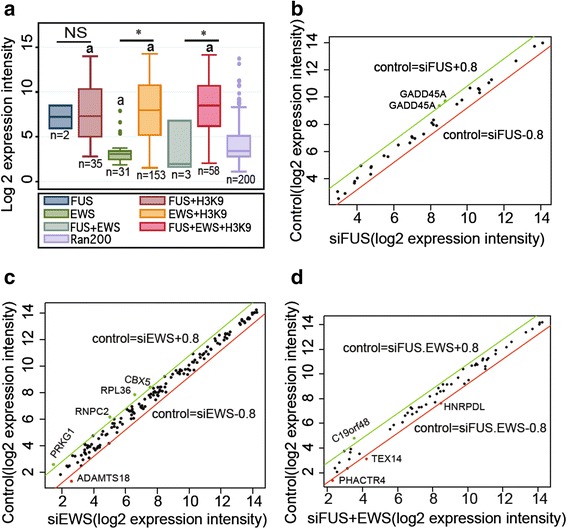
FUS and EWS bind with preference actively transcribed genes. a Box plot of log 2 expression intensity of FUS, EWS, and combined FUS and EWS target genes either without or with additional Ac-H3K9 enrichment. A random selection of 200 probe sets was used as microarray control probe set. “a”, p-value < 0.05, for data sets compared against the randomly selected 200 probe sets; “*”, p–value < 0.05, when comparing ChIP-seq signatures with and without H3K9; NS, non-significance. b-d Dot plots comparing microarray data for control and individual or coupled FUS and EWS siRNA transfected cells with ChIP-seq signatures for FUS and Ac-H3K9 (n = 35) (b), EWS and Ac-H3K9 (n = 153) (c) or FUS and EWS and Ac-H3K9 (n = 58) (d). The red line indicates the significant up-regulation boundary of log (siRNA-control) fold change = 0.8, and the green line indicates the significant down-regulation boundary of log (siRNA-control) fold change = −0.8
