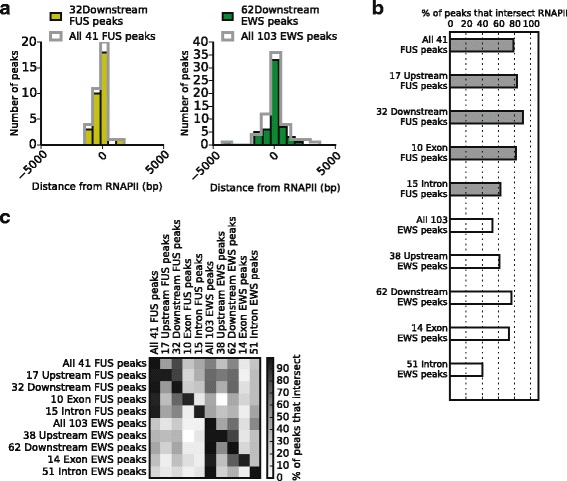
Fig. 5.

EWS and FUS binding downstream the poly(A)-signal overlap with RNAPII binding. a The distance in base pairs (bp) for the 41 FUS gene localized and the 32 FUS downstream localized ChIP-seq peaks (yellow), as well as for the 103 EWS gene localized and the 62 EWS downstream localized ChIP-seq peaks (green), to RNAPII binding (26,323 ChIP-seq peaks from ENCODE Project Consortium). Distances were plotted as histograms, where x = 0 indicate the center of RNAPII binding. The y-axis show the number of FUS and EWS ChIP-seq peaks in each bar. b Presentation of the percentage of FUS (grey) and EWS (white) ChIP-seq peaks, both for the total number of gene localized peaks, as well as peaks belonging to different categories for gene localization, intersecting at least one base with RNAPII peaks. c Presentation of the percentage of FUS and EWS ChIP-seq peaks, both for the total number of gene localized peaks, as well as peaks belonging to different categories for gene localization, that intersect (at least one base). At the right side is shown the coloring code for the intersection percentages. The percentage of FUS, EWS, and RNAPII intersection with a randomized generated peak set was < 1.8 % based on 1 x 10⁵ simulations of the randomized peaks having the same length and chromosome distribution as the RNAPII ChIP-seq peaks yielding a significance level of p < 1 x 10⁻⁵
