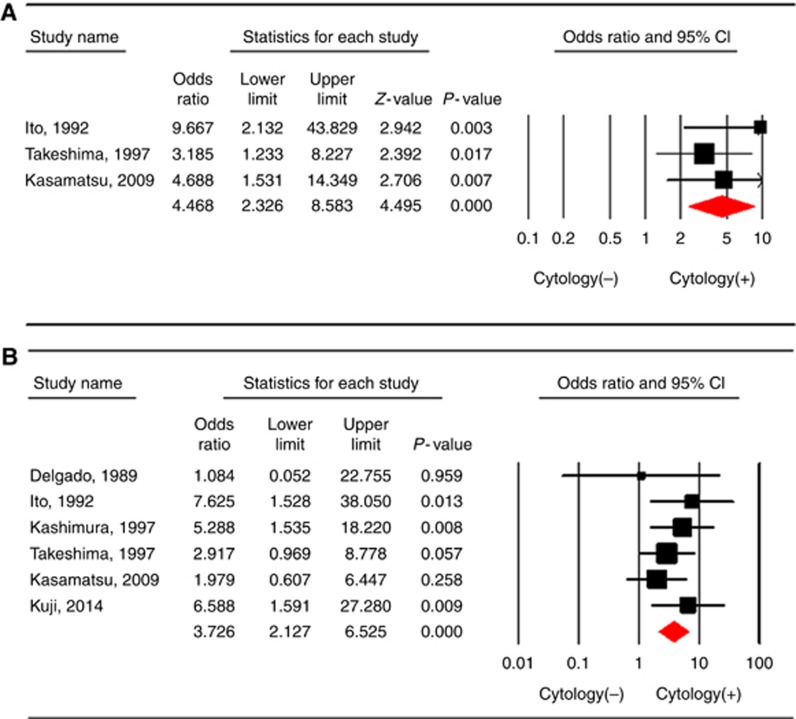
Figure 2.
The odds ratio for the risk of (A) recurrence and (B) LN metastasis for each study and all studies combined comparing positive peritoneal cytology with negative cytology in a meta-analysis based on the fixed-effects model. Heterogeneity was low across studies (A: P=0.473 and I2=0% B: P=0.606 and I2=0%). The size of each square is proportional to the sample size for each study, and the horizontal line through the square indicates the 95% confidence interval for that study. For the pooled analysis, the diamond indicates the pooled value, and the right and left ends of the diamond indicate the 95% confidence interval for the analysis.

