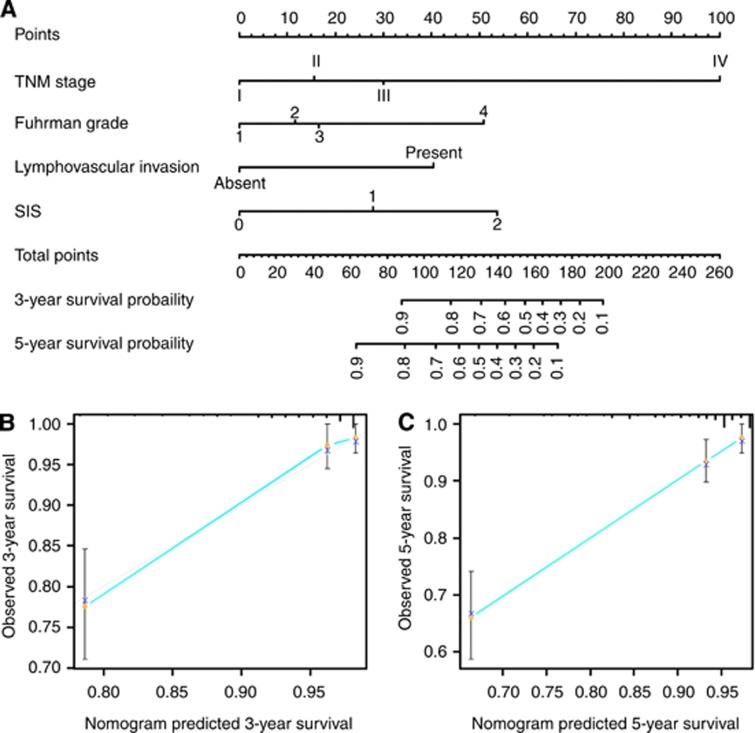
Figure 3.
Nomogram for predicting 3- and 5-year OS of ccRCC patients after surgery. (A) Nomogram for predicting 3- and 5-year OS of ccRCC patients after surgery. Calibration plot of the nomogram for (B) 3-year and (C) 5-year survival. The dashed line represents the performance of an ideal nomogram. The blue line indicates the performance of the proposed nomogram. Orange circles are sub-cohorts of the data set; X is the bootstrapped corrected estimate of nomogram with 200 resamples. Vertical bars represent 95% CI. It seems that the nomogram predicts accurately 3- and 5-year OS.

