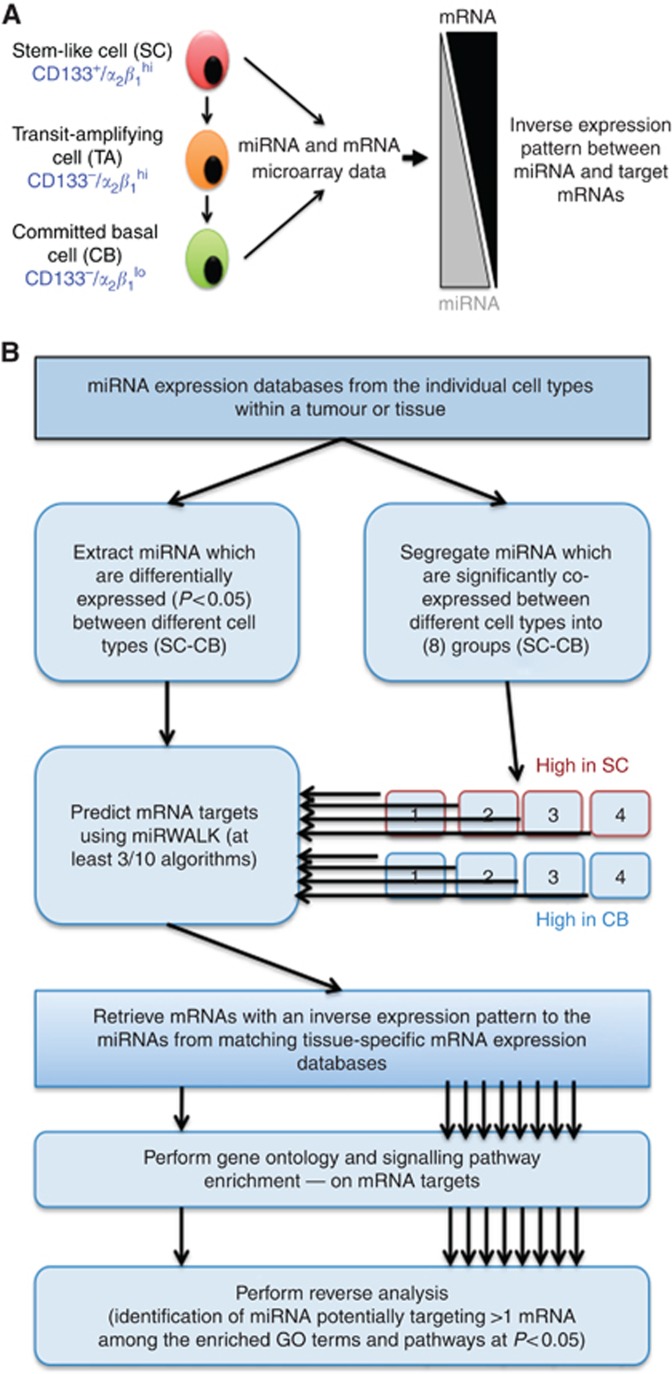
Figure 1.
Generation of integrated miRNA-mRNA data sets using expression data from prostate SC and CB cells. (A) A schematic of human prostate epithelial hierarchy (left) showing a stem-like cell (SC) with a basal phenotype differentiating into committed basal (CB) cell via transit-amplifying (TA) cell. The nature of inverse expression relationship between miRNA and its target mRNAs is depicted on the right side. For the purpose of data integration, only the expression profiles from SC and CB cells were used. (B) Algorithm used to generate integrated miRNA-mRNA data set. Two approaches were taken: one without co-expression analysis on miRNA data and second with co-expression analysis. The eight sub-groups in co-expression analysis were kept separate at each subsequent step in the analysis.

