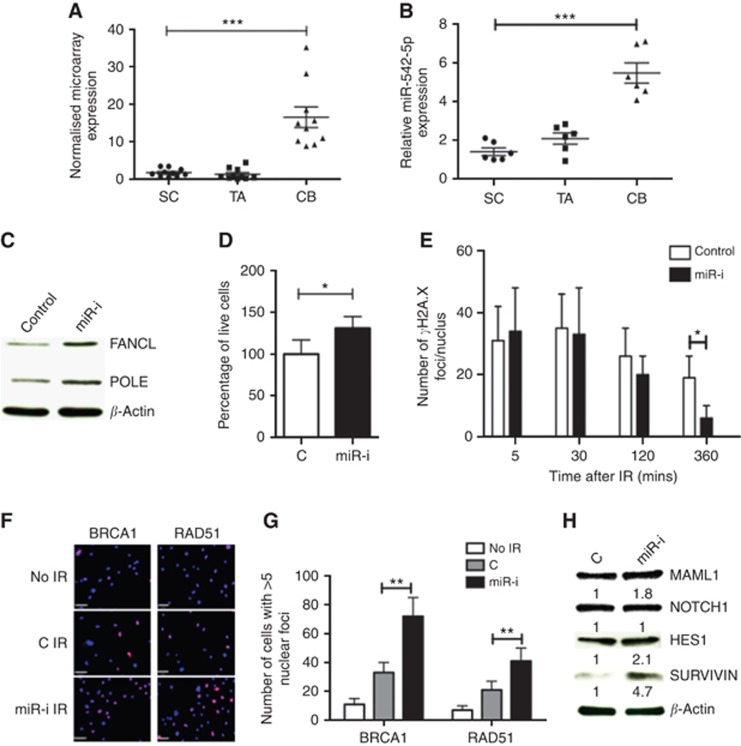
Figure 2.
Proof-of-principle experiments to validate miRNA-mRNA database predictions using miR-542-5p. (A) miR-542-5p expression in miRNA microarray data set and (B) qRT-PCR validation on independent samples. CB cells were then transfected with 100 nM miR-542-5p-inhibitor (‘miR-I') or negative control (‘C') for 3 days. The expression of FANCL and POLE proteins was assessed by western blot (C). These cells were irradiated with 5 Gy IR before counting live cell count after 48 h of IR (D), γ-H2AX immunofluorescence foci/nucleus recovery (E), BRCA1 and RAD51 nuclear positivity 2 h after IR (F) Blue: DAPI and lilac: BRCA1/RAD51, and quantification is shown in G. Protein expression changes in MAML1 and Notch-associated effector proteins HES1 and Survivin (H). Error bars=60 μm. Each experiment represents mean of 3 BPH and 3 PCa and plotted as mean±s.d. *P<0.05, **P<0.01, ***P<0.001 (Student's t-test). Abbreviations: SC=stem-like cells; TA=transit-amplifying cells; CB=committed basal cells; BPH=benign prostatic hyperplasia; PCa=treatment naive Gl-7 prostate cancer; miR-I=miR-542-5p inhibitor; C=inhibitor negative control.

