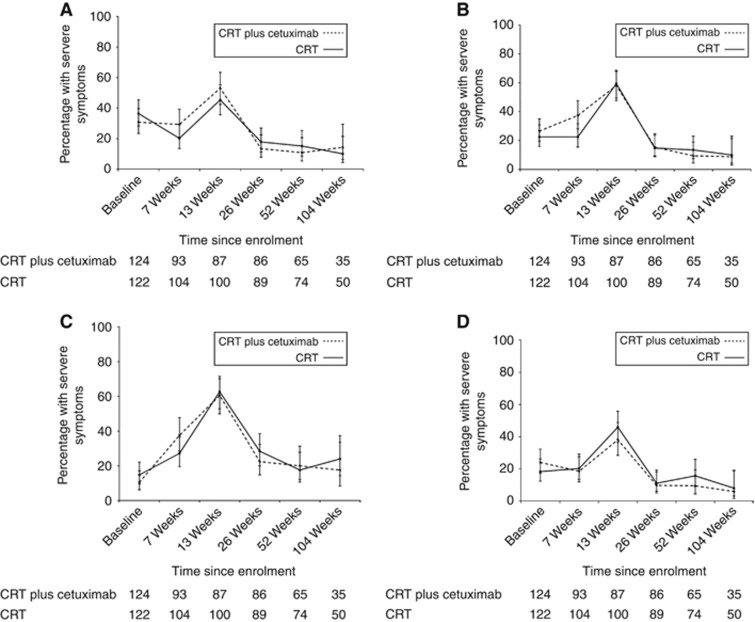
Figure 3.
Line graphs showing the (A) Proportions of patients with severe eating restrictions and 95% CIs during treatment. (B) Proportions of patients with severe appetite loss and 95% CIs during treatment. (C) Proportions of patients with severe fatigue and 95% CIs during treatment. (D) Proportions of patients with severe dysphagia and 95% CIs during treatment.

