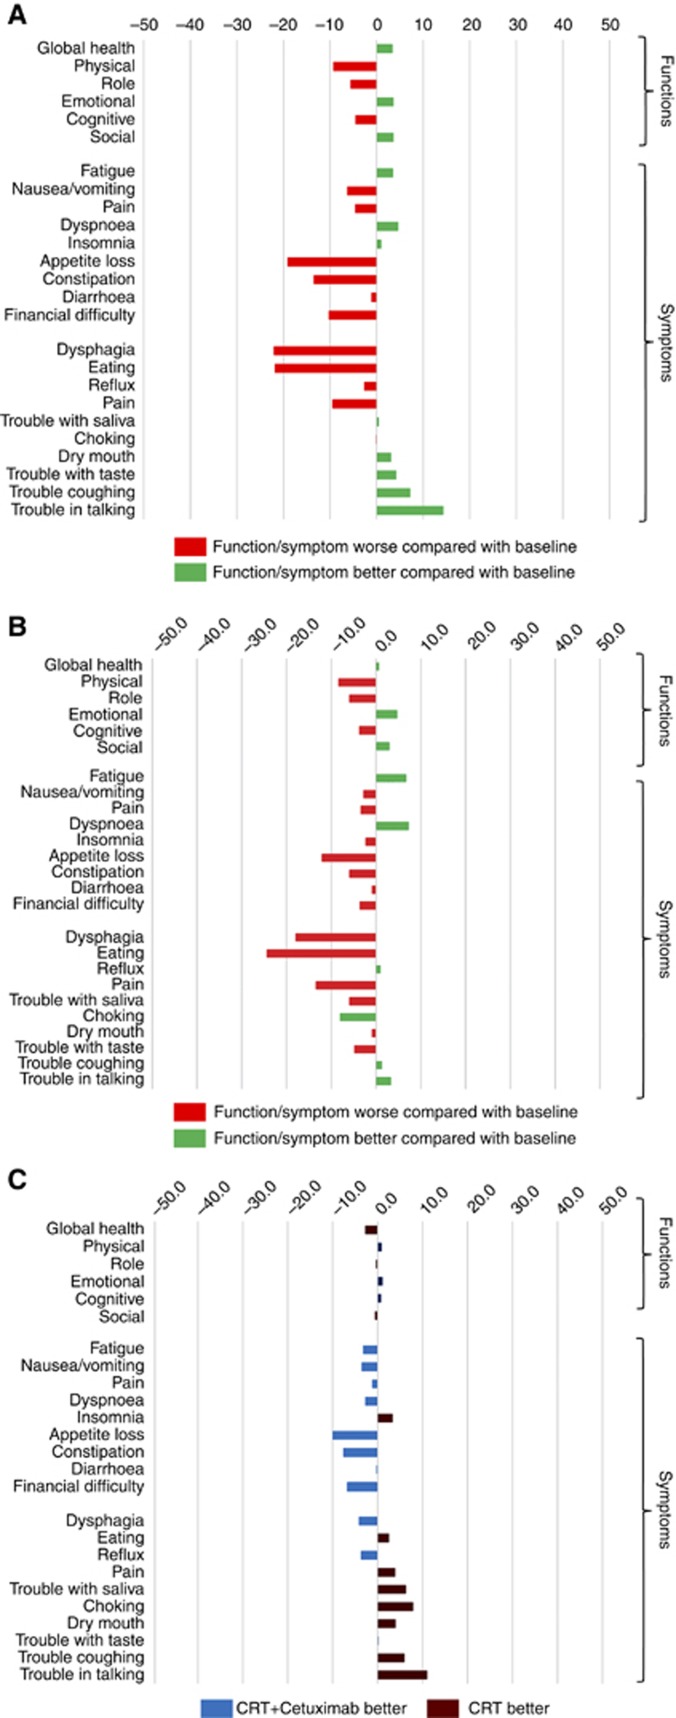
Figure 6.
Waterfall plot showing (A) Mean change in PRO scores from baseline to 104 weeks in patients receiving chemo-radiotherapy and cetuximab. (B) Mean change in PRO scores from baseline to 104 weeks in patients receiving CRT alone. (C) Mean change in HRQL outcomes from baseline to 104 weeks. Positive values in the functional scales and negative values for the symptom scale denote overall benefit from CRT with cetuximab (CRT+Cetuximab) compared with CRT alone.

