
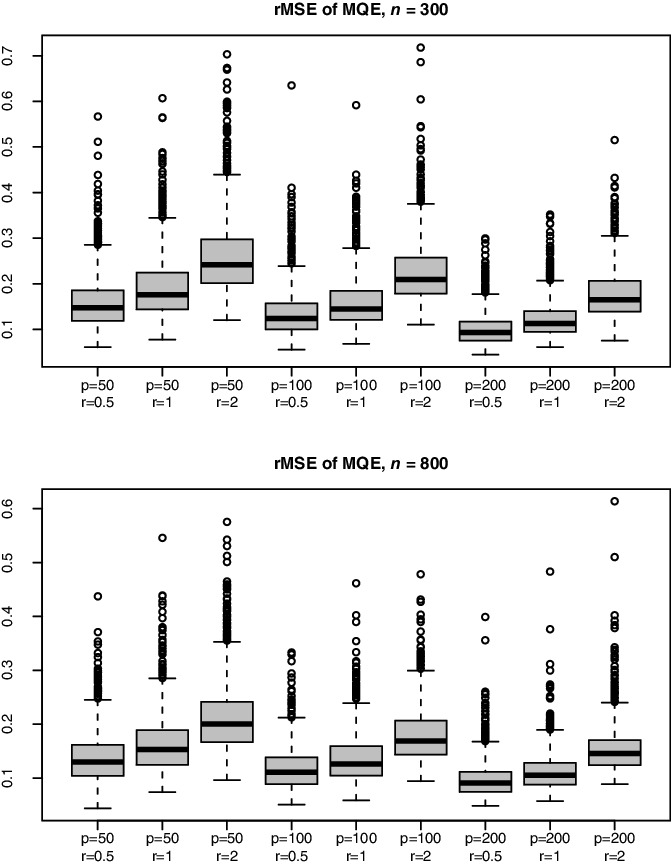
Figure 3 . Boxplots of rMSE() defined in (6.2) with sample size n = 300 or 800, dimension p = 50, 100, or 200, and the noise-to-signal ratio r = 0.5, 1, or 2.
Official websites use .gov
A
.gov website belongs to an official
government organization in the United States.
Secure .gov websites use HTTPS
A lock (
) or https:// means you've safely
connected to the .gov website. Share sensitive
information only on official, secure websites.