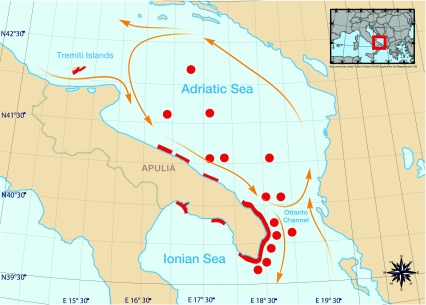
Figure 1. The peak of salp presence (early May 2013) along the Apulian coast.
Coastal presences from both citizen science records and authors’ own observations were aggregated with the software Fishery Analyst, offshore records derive from onship observations during the CoCoNet Cruise. Yellow lines: trajectories of the main currents.

