
Fig. 3.
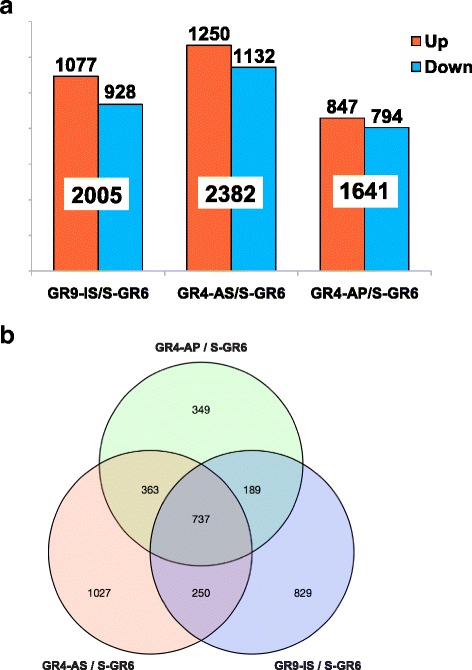
Graph bars and venn diagram of differentially expressed unigenes of the three resistant strains. a) Distribution of differentially expressed unigenes of the resistant strains compared to the susceptible strain (log2FC >1, FDR < 0.05). In each strain up and down regulated unigenes are indicated. b) Venn diagram of differentially expressed unigenes in the three resistant strains. For each Venn diagram section, the numbers of transcripts differentially expressed in any insecticide resistant strain as compared to the susceptible strain are indicated