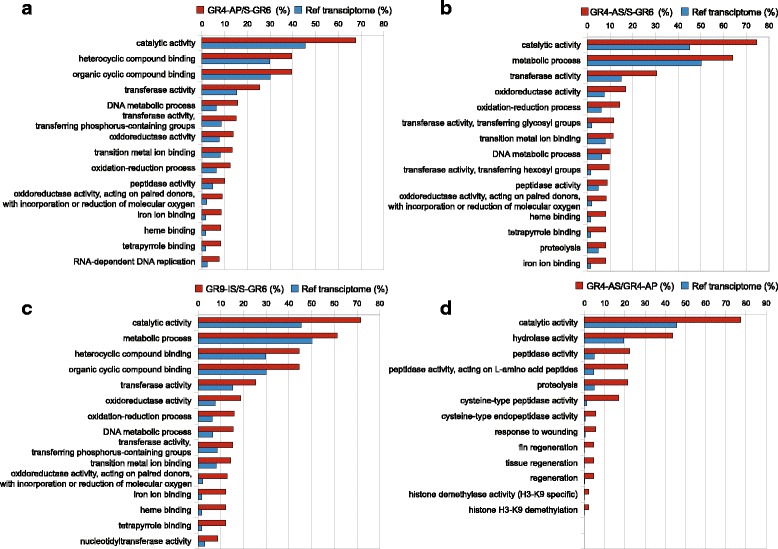
Fig. 4.

GO bar diagrams of over-represented and up-regulated genes. Each diagram shows the first 15 GO terms over-represented and up-regulated genes in the three resistant strains vs S-GR6 (a, b and c) and the first 13 GO terms in GR4-AS vs GR4-AP (d). Fisher’s exact test (adjust p-value <0.05) on the GO terms
