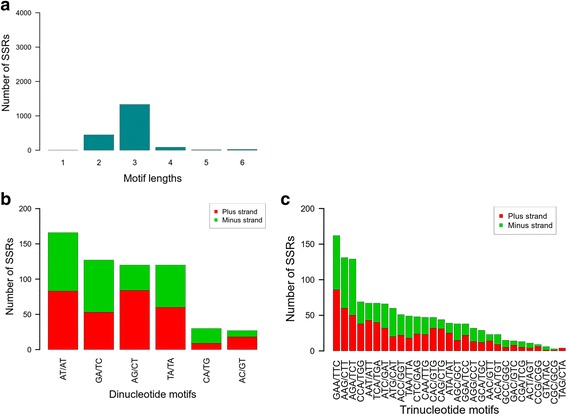
Fig. 3.

SSR length and motif distribution. The number of mono- to hexanucleotide SSR motifs was counted (a). The nucleotide compositions of the most frequent motifs (di- and trinucleotide motifs) were determined for each type and are illustrated in a bar plot for dinucleotide (b) and trinucleotide motifs (c). Motifs that are reverse-complementary were plotted as stacked bars: “plus strand” (red) and “minus strand” (green)
