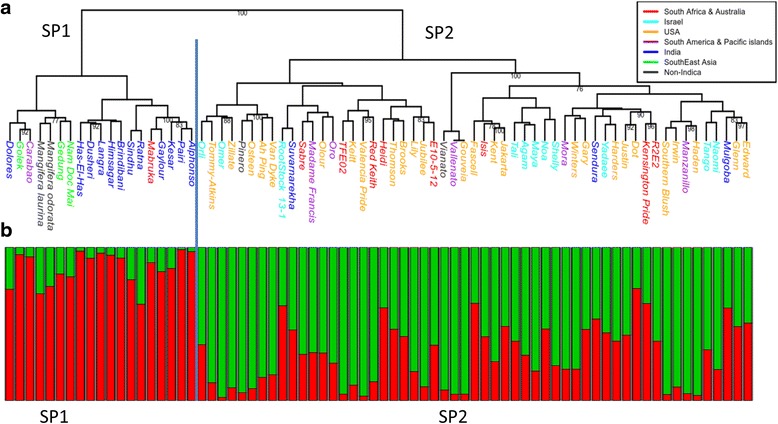
Fig. 4.

Dendrogram and genetic structure of 74 accessions in the Israeli mango germplasm collection. Genotyping of 74 mango accessions from the Israeli mango collection was performed with 239 SNPs. The genotyping results were used to classify the accessions into sub-populations and reveal their genetic structure. a Classification was performed by drawing a dendrogram based on 1- proportion of shared alleles (PSA) as a genetic distance. Only confident branches with bootstrap values ≥90 were assigned. The two major groups are notated as subpopulation 1 (SP1) and as subpopulation 2 (SP2). b Genetic structure was revealed by STRUCTURE program with K = 2 as found by simulation and ΔK likelihood method. The division of STRUCTURE’s Q-value bar plot into two (vertical blue line) corresponds to the two major significant clusters in the dendrogram. Note that the Y-axis (not plotted) scale is between 0 and 1 and represents proportion
