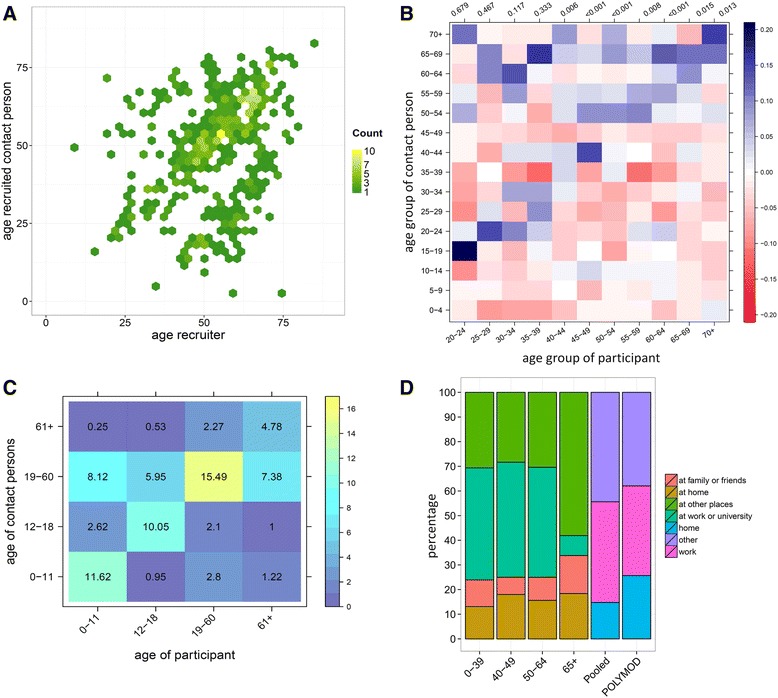
Fig. 2.

Recruitment and contact persons by age. a Recruitment patterns by age (npairs: 488). b Difference between recruitment matrix and contact matrix by age of Dutch POLYMOD. Colours and scale indicate for each cell the proportional difference between both matrices, for the particular participant’s age group and his/her contact person’s age group (note: recruitment matrix minus POLYMOD matrix). For each participant’s age group, integer counts of contact persons were compared with POLYMOD using a two-sample KS test, the p values are shown above each column. c Contact persons reported in questionnaire by participants, values indicate the average number of contact persons in an age group recorded per day by participants. d Contact location by age groups and pooled for comparison with POLYMOD. The first four columns show the locations as displayed in the questionnaire. For comparison with POLYMOD, the sample was weighted for the size of POLYMOD age groups (weights are displayed in Additional file 1), and the category “at the home of family and friends” was combined with “other”. POLYMOD was regrouped as “home”, “work” (at work and at school combined) and “other” (leisure, travel and other combined), frequency of contact with the same person was ignored and for contact at multiple locations only the first entry was counted (equivalent to our questionnaire)
