
Fig. 5.
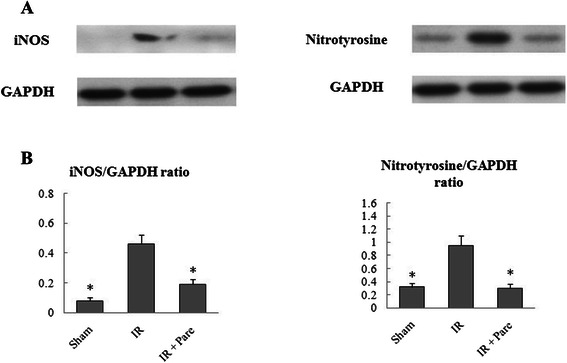
Effect of parecoxib administration on iNOS and nitrotyrosine expression in liver homogenates. a Western blot results for iNOS and nitrotyrosine. b Relative amount for iNOS and nitrotyrosine. Data presented as means ± SE (n = 4/ group) and compared by one-way ANOVA and SNK method. *P < 0.05 vs. I/R group