Fig. 1.

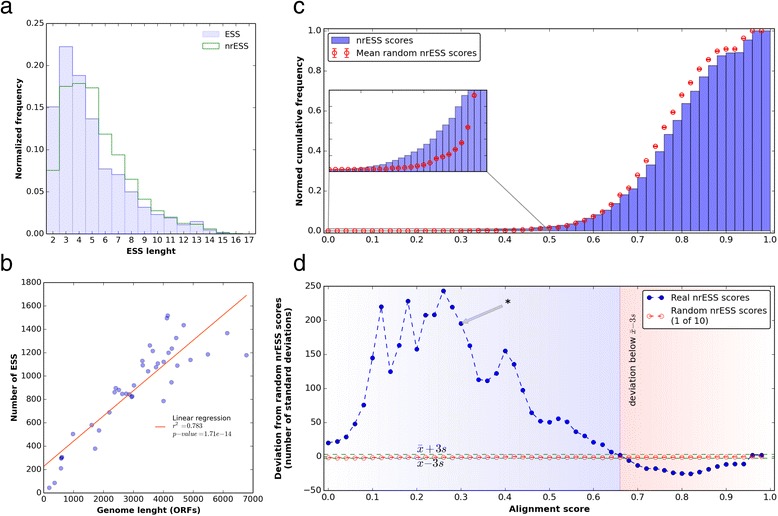
Construction and alignment of Enzymatic Step Sequences (ESS). a Histogram of the distribution of ESS and nrESS according to their lengths. b Number of total ESS constructed per organism. The x-axis represents the genome size according to the number of ORFs, and the y-axis corresponds to the total number of ESS generated using the strategy presented in the text. Each point corresponds to one organism. c Cumulative histogram of the nrESS pairwise alignment scores. Blue bars represent the real nrESS scores; red points represent the mean distribution ± SD from random ESS. The SD were so small that they are not visible in the plot. The inset is an amplification of the lower portion of the plot and includes the scores from 0 to 0.5. d Deviation of the real nrESS score histogram relative to the mean ± SD of the random datasets. The blue dots correspond to the real data dispersion, and red dots correspond to single random database dispersions. Dotted green lines represent 3 SD from the mean of random histograms. The asterisk denotes the dispersion at 0.3. This score was used as the similarity threshold
