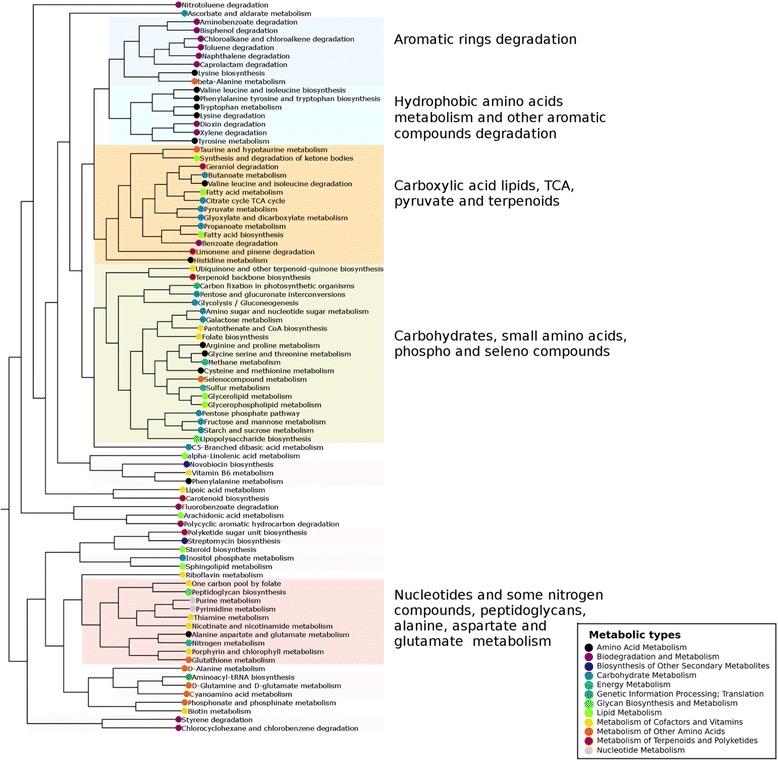
Fig. 4.

The metabolic map that includes similar compounds exhibits similar ESS. The hierarchical clustering was constructed by comparing the normalized counts of shared pairwise nrESS alignments, using the Spearman rank correlation and average linkage method. A cutoff of 0.46 of the total length of the clustering was used to define the number of clusters. The major and minor (pale pink) clusters are shown, and their corresponding KEGG metabolic types are indicated
