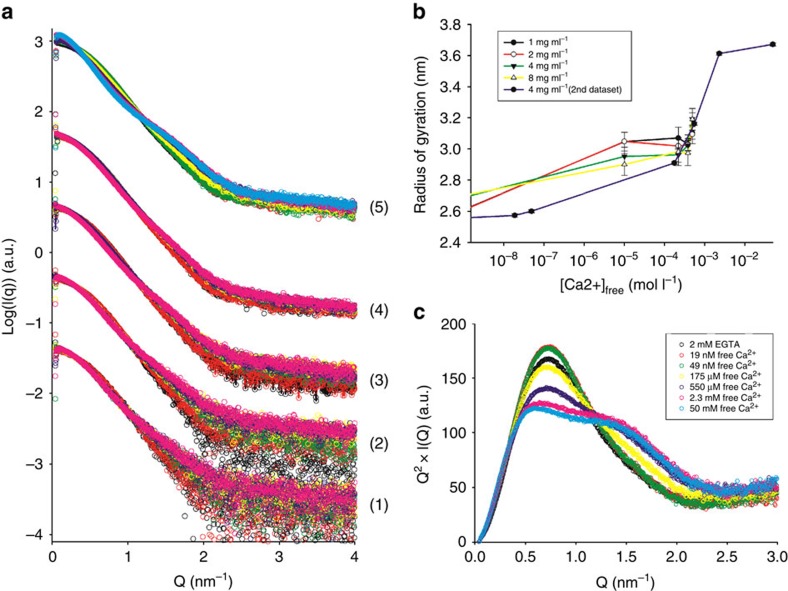
Figure 2. SAXS experiments.
(a) SAXS profiles of A1–A3 in the presence of 10 mM EGTA (black spheres), 2 mM EGTA (red spheres) and with increasing calcium concentrations (10, 220, 390 and 490 μM CaCl2, green, yellow, purple and pink spheres, respectively) measured at protein concentrations of 1, 2, 4 and 8 mg ml−1 (curve series 1, 2, 3 and 4, respectively). Curve series (5) corresponds to a second calcium titration at 4 mg ml−1 that spans a larger range of calcium concentrations (2 mM EGTA, 19 and 49 nM, 175 and 550 μM and 2.3 and 50 mM free Ca2+) and was measured on a separate synchrotron visit using a different protein preparation. (b) Changes in radius of gyration as a function of calcium concentration corresponding to the curve series in a: (1) black, (2) red, (3) green, (4) yellow and (5) purple line. (c) Model-free analysis of calcium-induced conformational changes. The data shown in a, curve series (5) is represented as Kratky plots, indicating a transition towards a less globular and more flexible structure.

