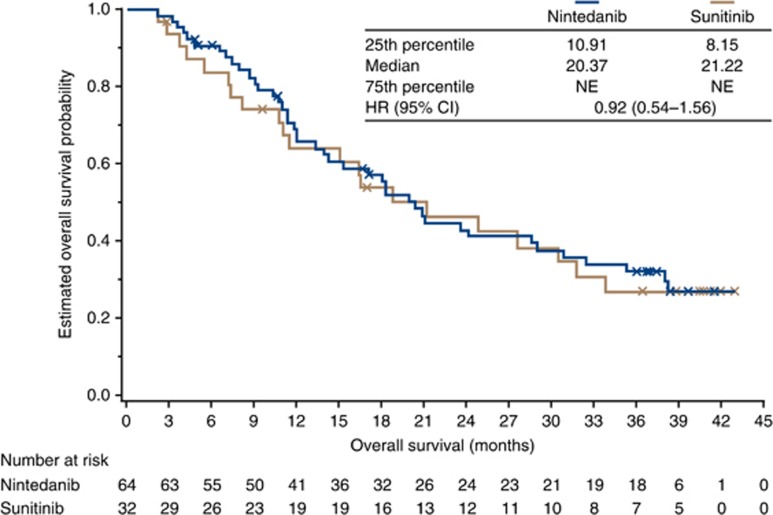
Figure 3.
Kaplan–Meier plot for overall survival. Patients without documented death at the time of analysis were censored on the date that they were last known to have been alive. Crosses denote censoring events. At the cut-off date for 3-year analysis, 42 patients (65.6%) in the nintedanib group and 21 (65.6%) in the sunitinib group had died. Hazard ratio and confidence intervals for the overall treatment groups were obtained from Cox proportional hazards models stratified by Motzer risk score and previous surgery. Abbreviations: CI=confidence interval; HR=hazard ratio; NE=not evaluable.

