Figure 1.
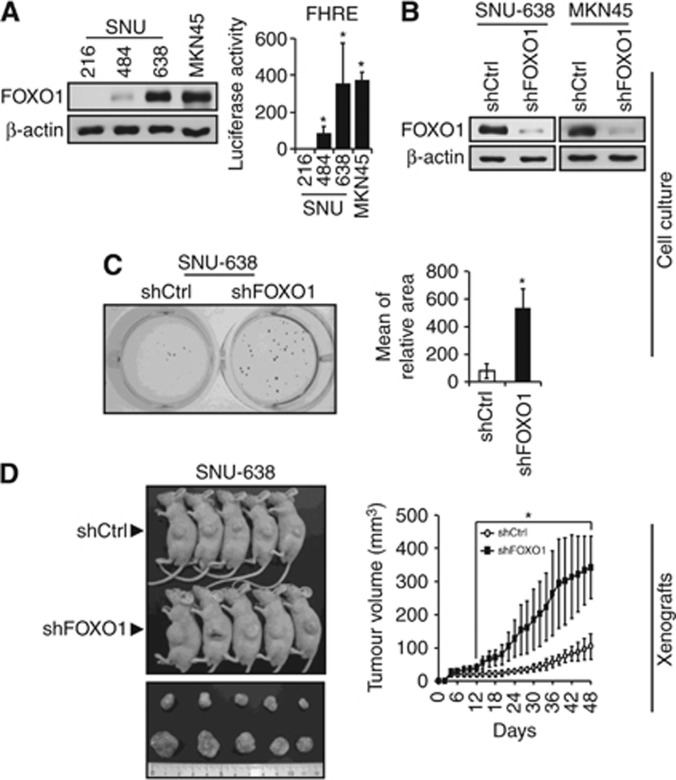
Effect of FOXO1 expression on GC cell growth in vitro and in vivo. (A) Protein expression and activation of FOXO1 in human GC cell lines were determined by immunoblot analysis and luciferase reporter assay. Bars represent mean±s.d. (n=4). *P<0.05, compared with SNU-216 cells. (B) GC cell lines (SNU-638 and MKN45) with high levels of FOXO1 expression and activity were infected with a lentivirus containing a construct, which encodes either control shRNA (denoted as shCtrl) or FOXO1 shRNA (denoted as shFOXO1). FOXO1 protein expression was determined by immunoblot analysis. (C) Soft-agar colony formation assay. Anchorage-independent growth of SNU-638 cells expressing shCtrl or shFOXO1 was measured in soft agar. On day 15 after plating, quantification of colony formation was performed by setting the number and size of colonies derived from shCtrl-expressing cells as 100%. Bars represent mean±s.d. (n=3). *P<0.05, compared with shCtrl. (D) SNU-638 cells expressing shCtrl or shFOXO1 were injected subcutaneously into the left flanks of BALB/c nude mice (n=5 per group). Representative photos of mice taken after killing at day 48 are displayed (left). The size of the tumour was measured over time (right). *P<0.05, compared with shCtrl.

