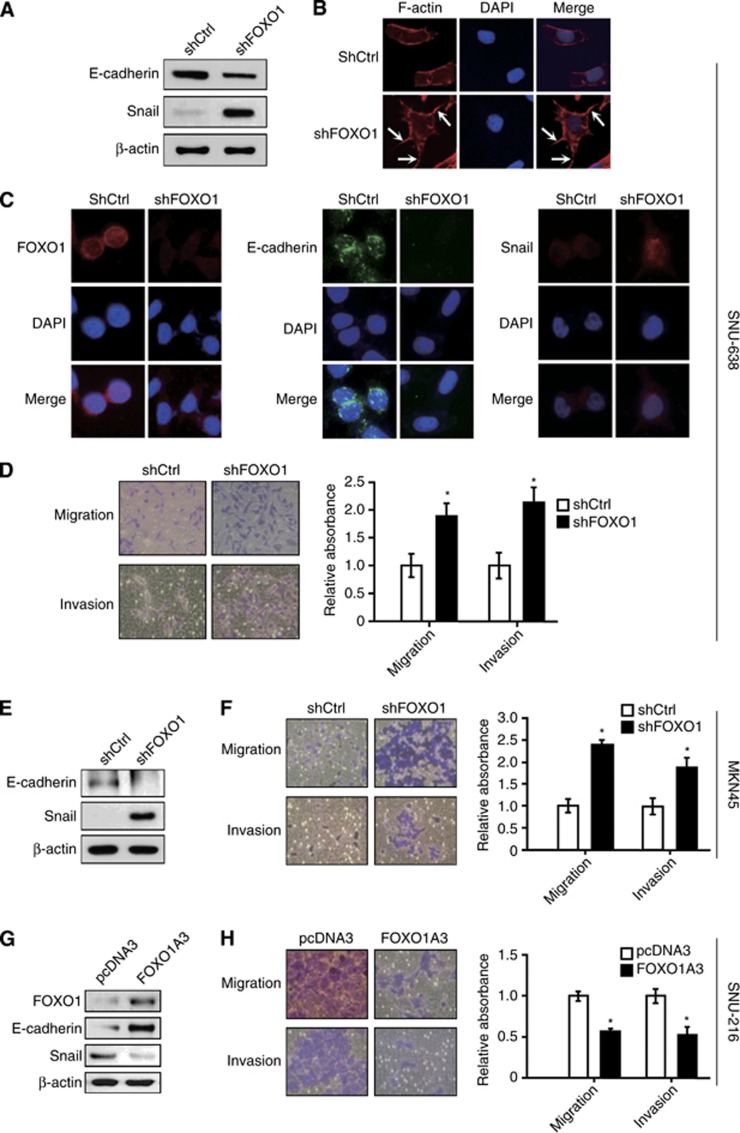
Figure 2.
The in vitro effect of FOXO1 on EMT, cell migration and invasion of SNU-638 cells, MKN45 cells and SNU-216 cells. (A and E) The expressions of E-cadherin and Snail in GC cells expressing either control shRNA (shCtrl) or FOXO1 shRNA (shFOXO1) were determined by immunoblot analysis. (B) Changes in the organisation of the actin cytoskeleton. Cells were stained with Alexa Fluor 633-conjugated phalloidin to visualise F-actin (red), and the cell nuclei were visualised by DAPI staining (blue). Arrows indicate the FITC-labelled filopodia-like projections. Photographs were taken with a fluorescence microscope ( × 400 magnification). (C) Immunofluoroscence stainings for FOXO1 (red), E-cadherin (green) and Snail (red) were performed. Cell nuclei were visualised by DAPI staining (blue) ( × 400 magnification). (D and F) The effect of FOXO1 silencing on cell migration/invasion was evaluated by Transwell migration assay and cell invasion assay followed by cell viability assessment using the crystal violet assay. Representative images of migrated/invasive cells taken 48 h after plating into a Transwell insert are on the left, and the quantification of migrated/invasive cells is on the right. The motility/invasiveness of cells expressing shCtrl corresponded to 1. Bars represent mean±s.d. (n=4). *P<0.05, compared with shCtrl. (G and H) SNU-216 cells were transfected with either control plasmid pcDNA3 or pFOXO1A3 (FOXO1A3). (G) The effect of FOXO1A3 transfection into GC cells on the expression of E-cadherin and Snail was determined by immunoblot analysis. (H) The effect of FOXO1A3 expression in GC cells on the cell migration and invasion was determined as described above. Bars represent mean±s.d. (n=4). *P<0.05, compared with vector control (pcDNA3).

