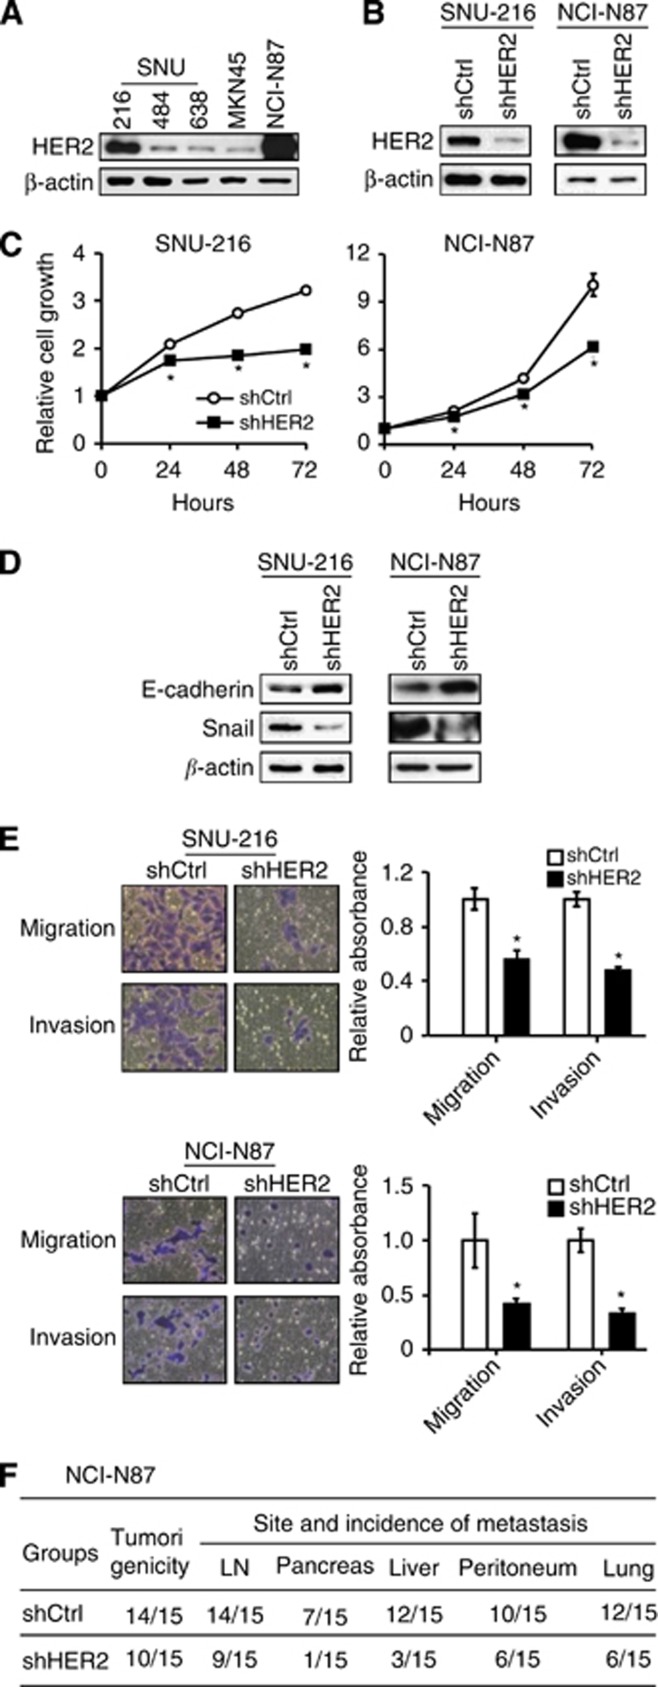
Figure 4.
Effects of HER2 silencing on oncogenic behaviours of GC cell lines in vitro and in vivo. (A) Expression of HER2 protein in parent GC cell lines was determined by immunoblot analysis. (B) GC cell lines (SNU-216 and NCI-N87) expressing a high level of HER2 were infected with a lentivirus containing either control shRNA (shCtrl) or HER2 shRNA (shHER2). HER2 protein expression was determined by immunoblot analysis. (C) Cells were cultured for 0–72 h and cell growth was determined using the crystal violet assay at the indicated times. The data are presented as mean±s.d. (n=6). *P<0.05, compared with shCtrl. (D) The effect of shHER2 transfection on the expressions of E-cadherin and Snail was determined by immunoblot analysis. (E) Effects of shHER2 transfection on cell migration and invasion of GC cells were analysed by Transwell migration assay and invasion assay, respectively. Bars represent mean±s.d. (n=4). *P<0.05, compared with shCtrl. (F) NCI-N87 cells expressing shCtrl or shHER2 were orthotopically injected into the stomach and were grown for 60 days (n=15 per group). The numbers of mice showing primary tumour formation, as well as site and incidence of metastasis are shown.

