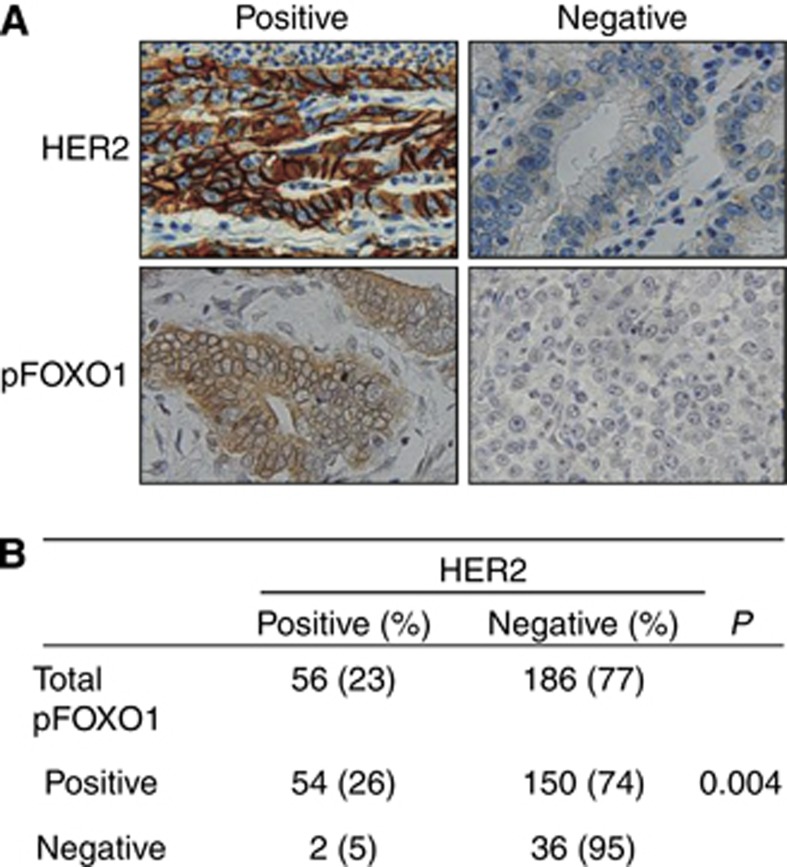
Figure 5.
Representative immunohistochemical features of HER2 and pFOXO1 in human GC specimens. (A) Positive versus negative examples for HER2 and pFOXO1 ( × 400 magnification). (B) Statistical analysis was performed using χ2-test. A positive relationship between the expressions of membranous HER2 and cytoplasmic pFOXO1 are shown (P=0.004).

