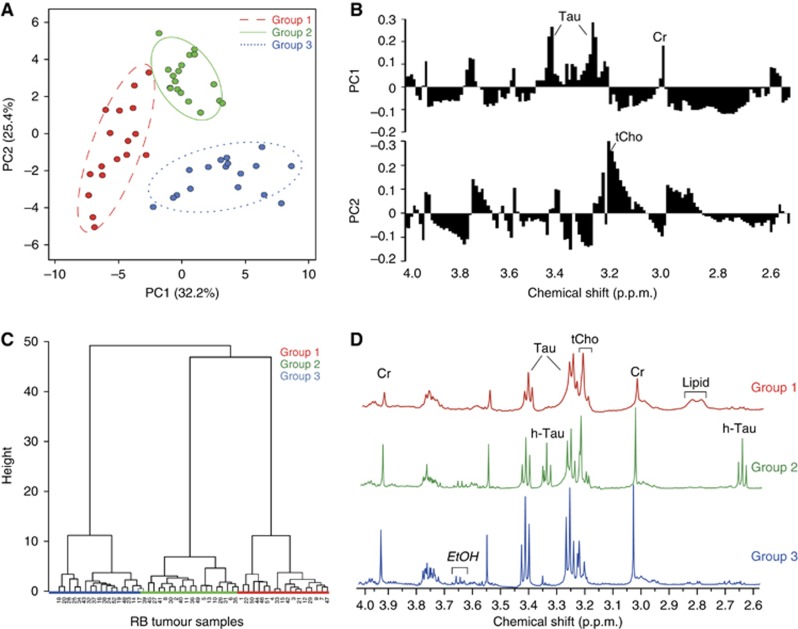
Figure 2.
Multivariate analysis of binned data from 2.6 to 4p.p.m. (A) Unsupervised PCA showing three groups of retinoblastomas. Scores in PC1 and PC2 are bounded by 95% confidence intervals. (B) Principal component analysis loading plots showing the contribution of spectral bins in PC1 and PC2. Taurine-related bins are a major feature of PC1, and choline-related bins in PC2. (C) Unsupervised hierarchical clustering also identifies the same three groups of retinoblastomas. (D) Representative spectra from each group showing characteristic metabolite features. Group 1 has low taurine (Tau) and creatine (Cr), no hypotaurine (h-Tau) and a visible lipid presence at 2.8p.p.m. (lipid group 6), group 2 has high total-choline (tCho) relative to taurine, high Cr and high hypotaurine, whereas group 3 has high taurine and creatine relative to other metabolites and very little lipids.

